How-To: Export your RADIUS Logs to Splunk
EZRADIUS enables your security team to monitor critical user actions by pushing the information to your SIEM. In this page we will show you how to connect your RADIUS logs to Splunk.
How To Connect Your Cloud RADIUS To Splunk
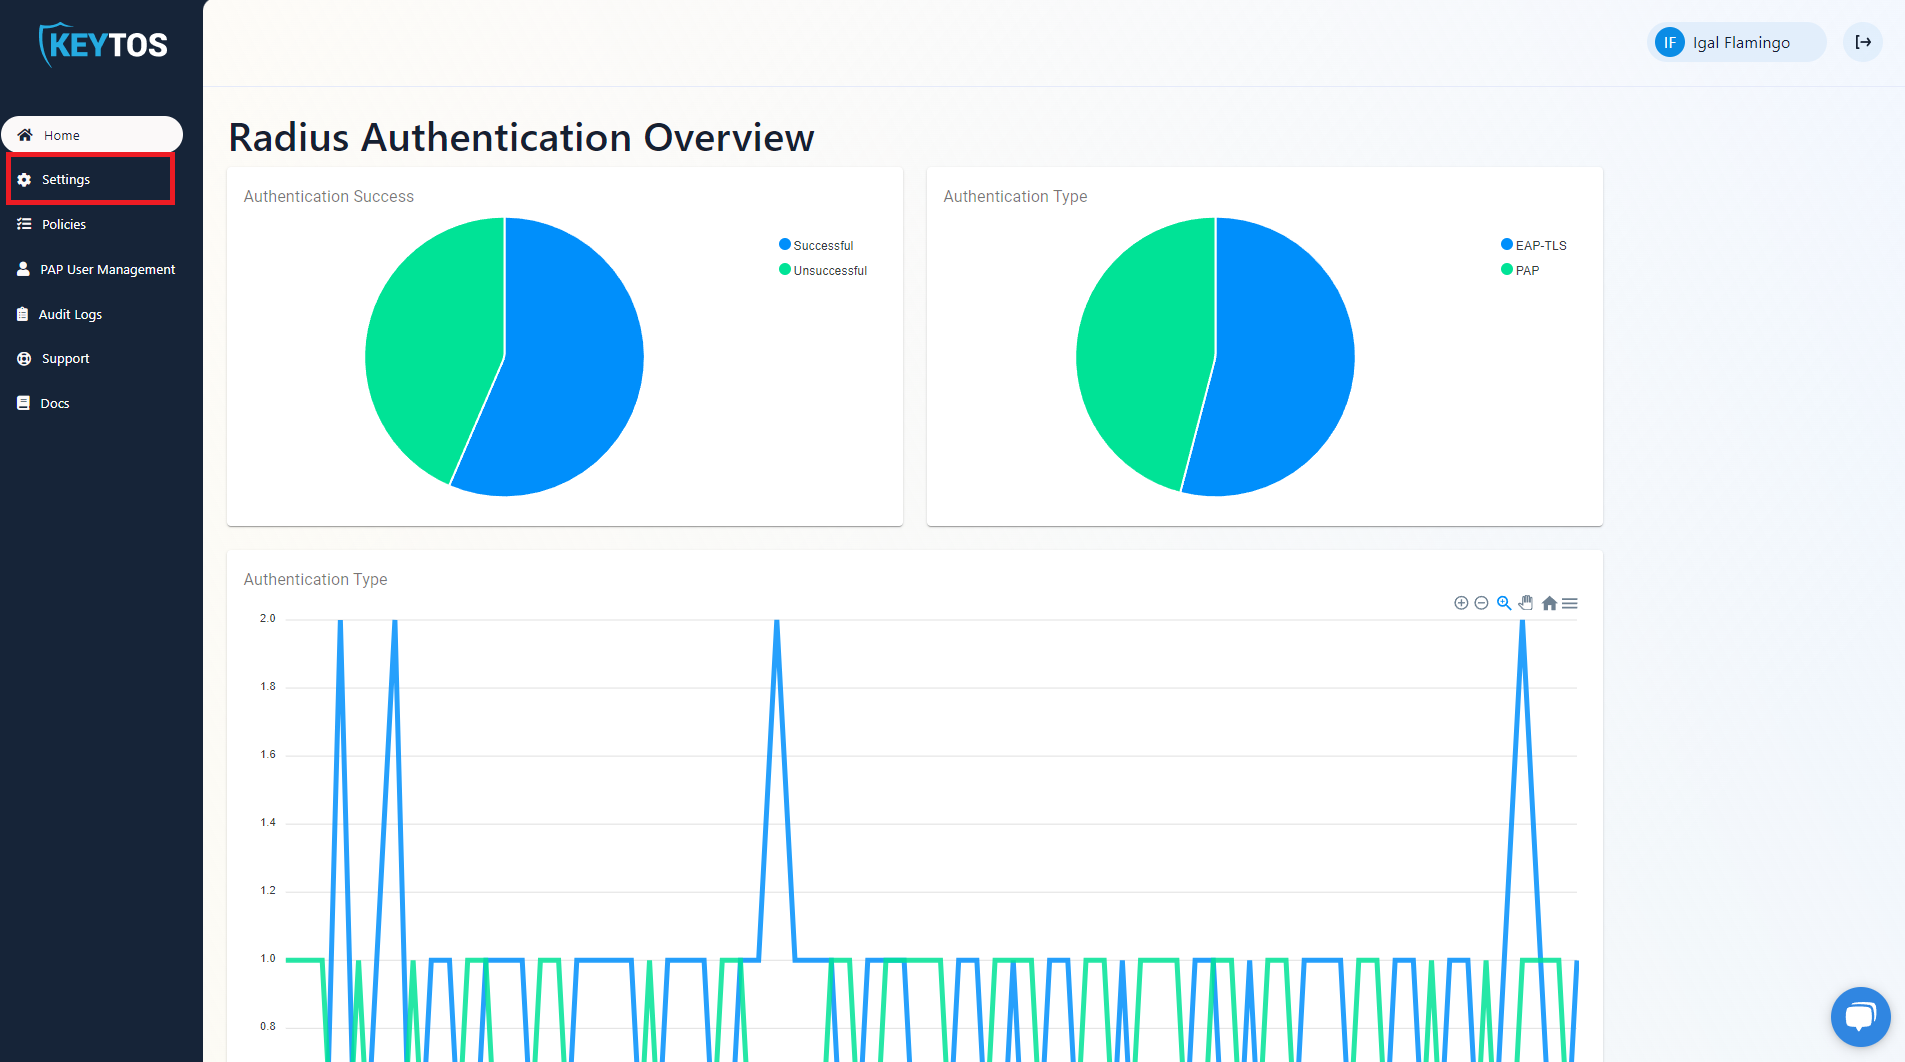
- Go to your EZRADIUS portal.
- Click on Settings.
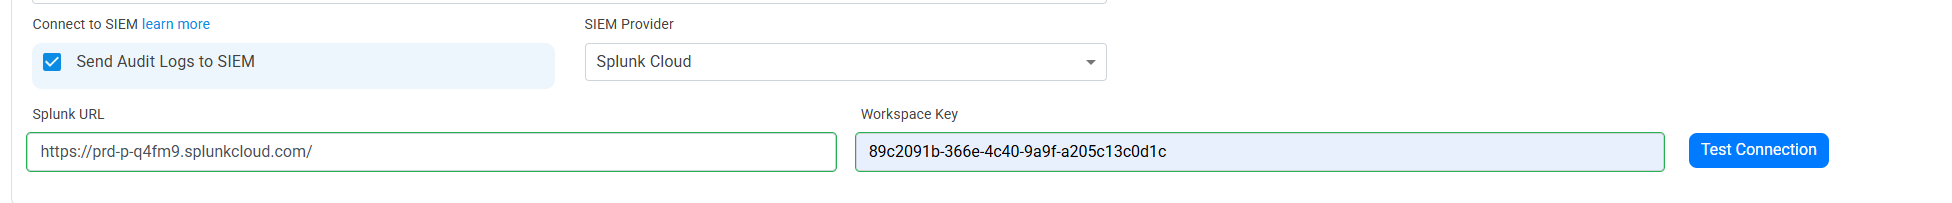
- Scroll to the bottom and enable the “Send Audit Logs” to SIEM option.
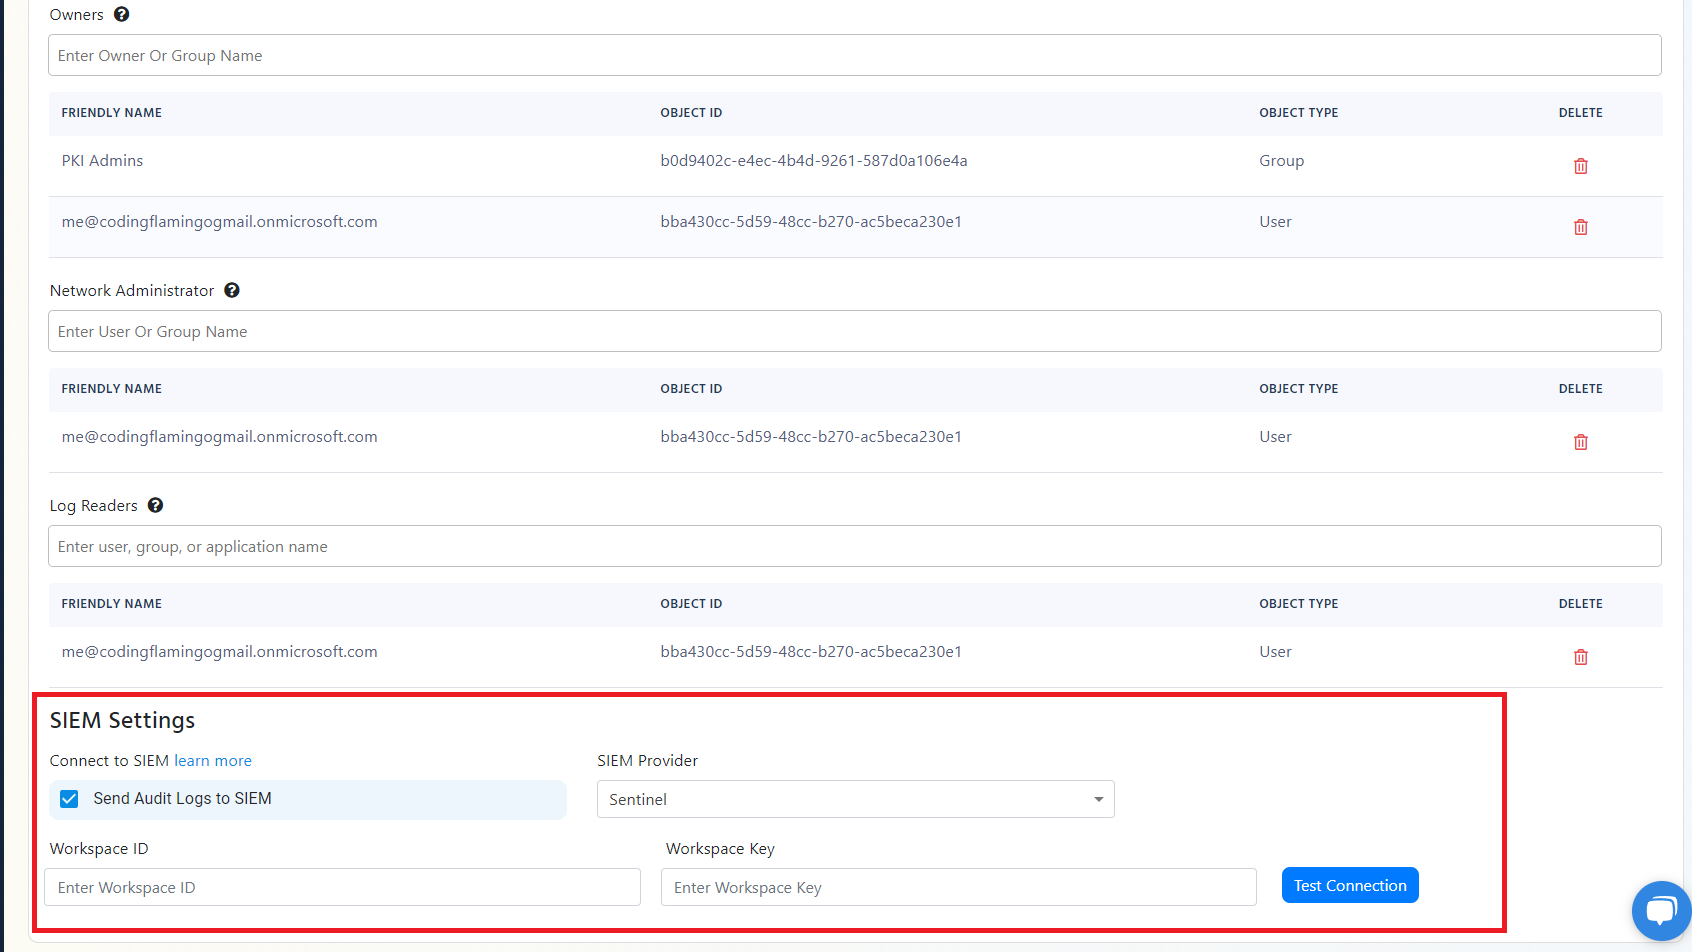
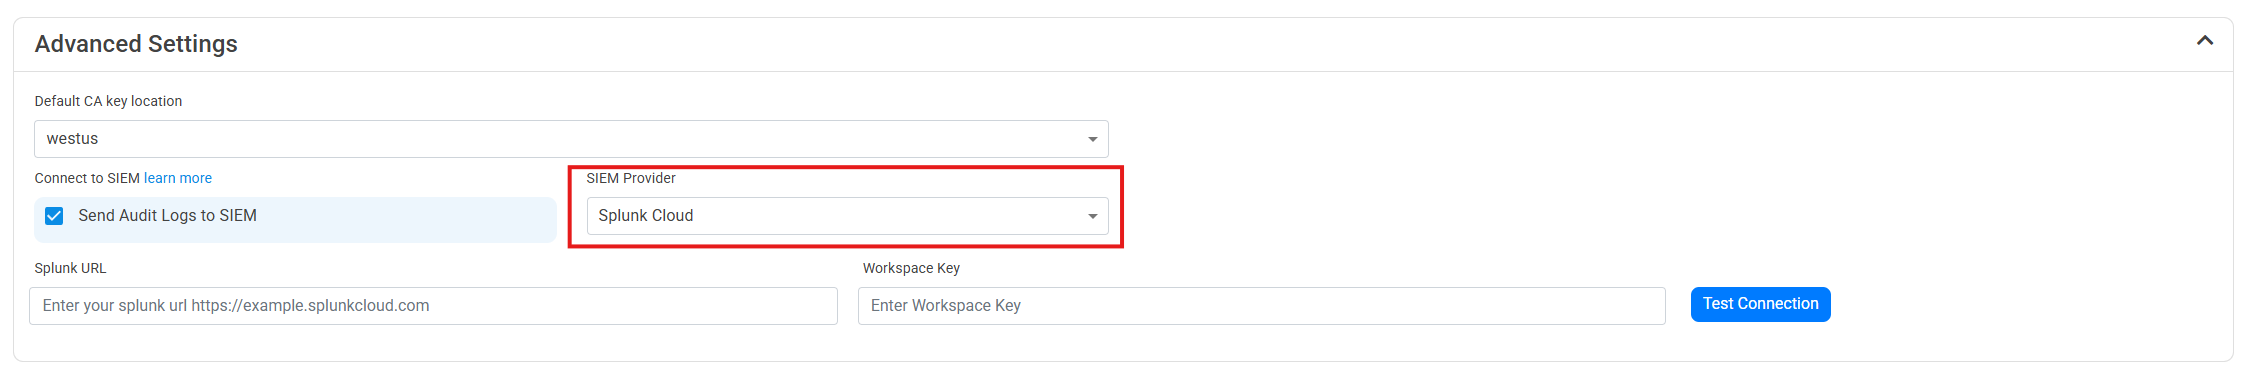
- Select Splunk as the SIEM Provider.
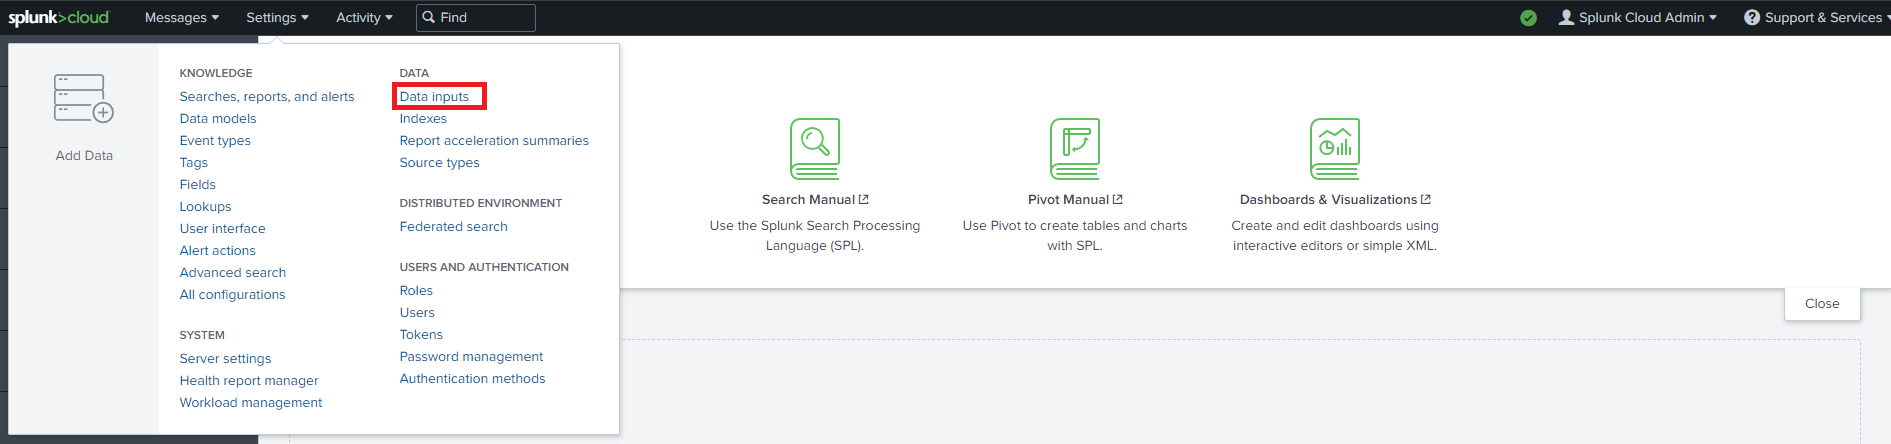
- In another tab, go to your Splunk instance.
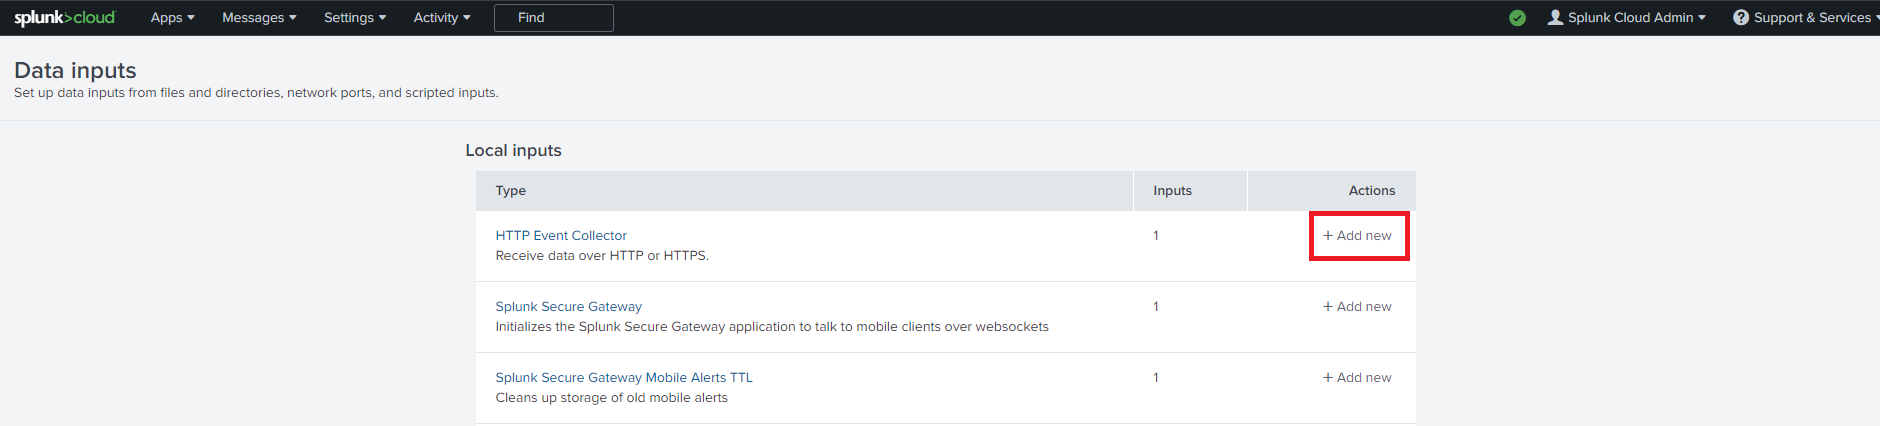
- Go to data inputs by clicking on the settings menu.
- Add a new Http Event Collector.
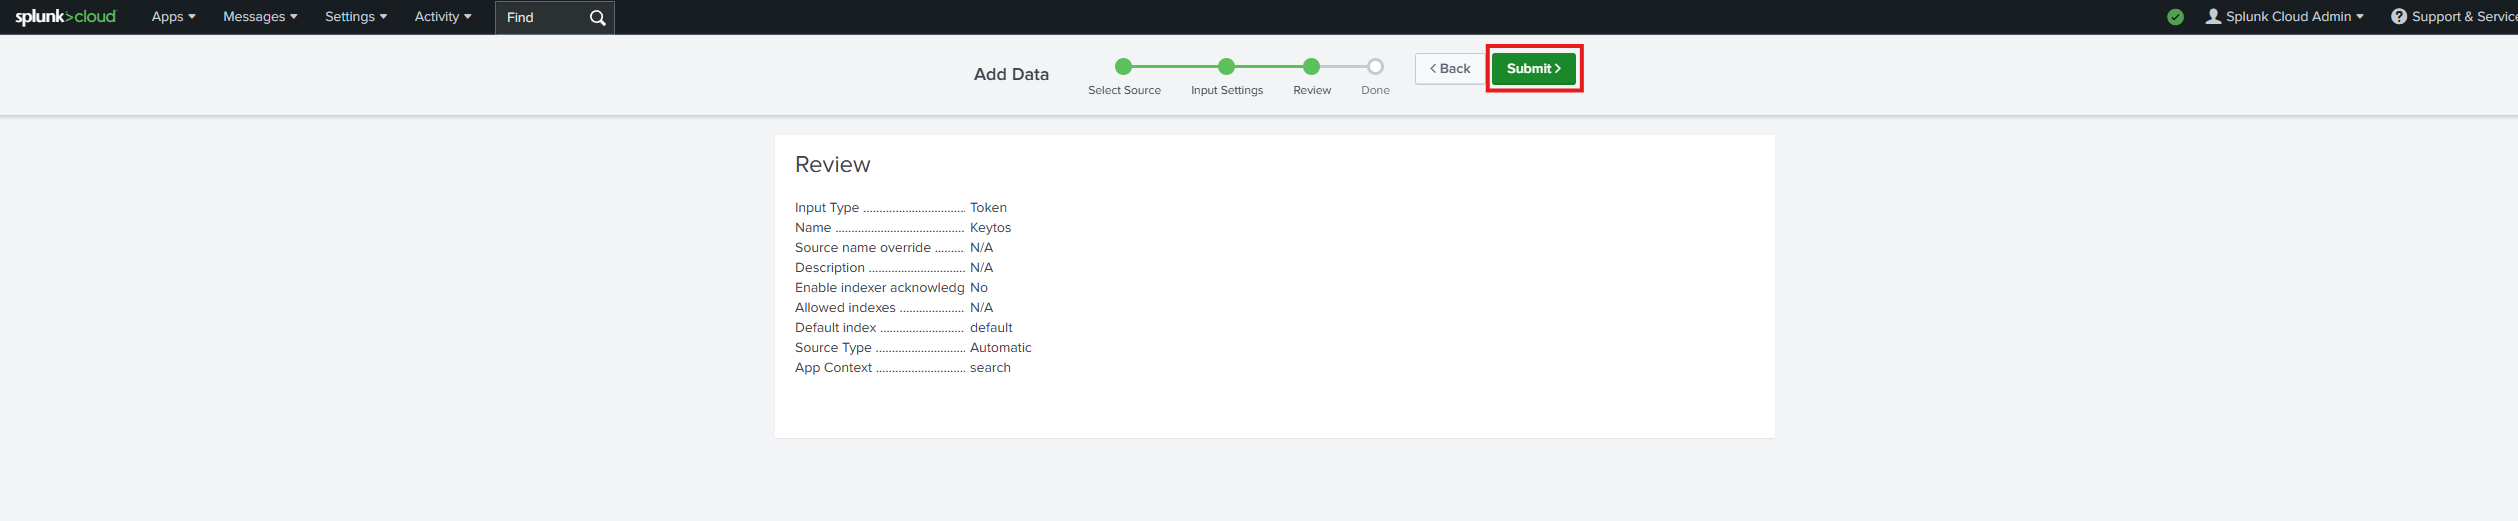
- Enter Keytos as the Name click next.
- Leave input settings with the default values and click next.
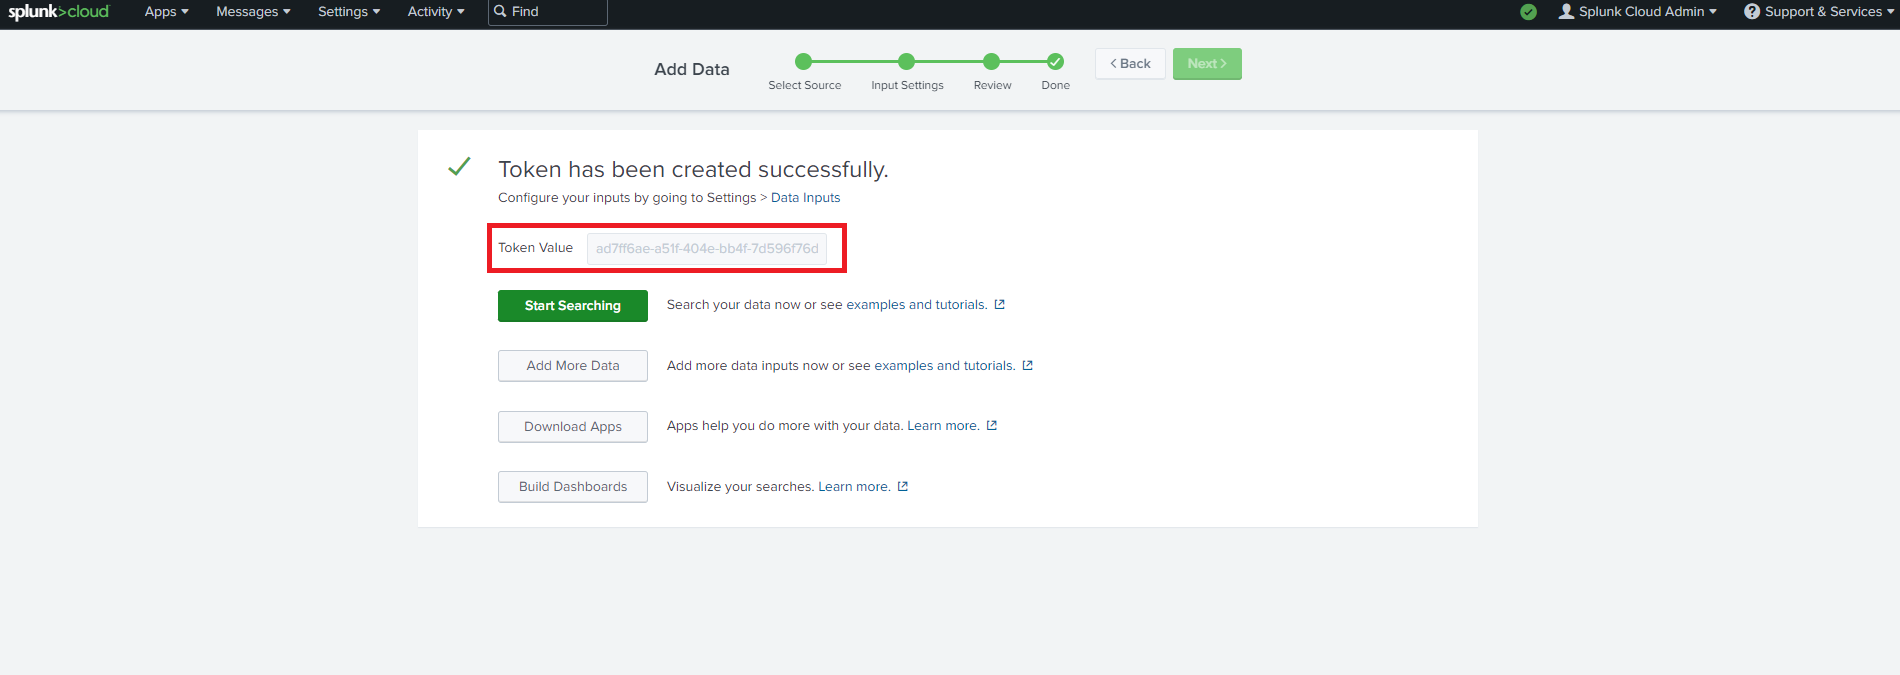
- Click Submit.
- Copy the splunk token we just created. Note this is a credential so do not share it publicly.
- Now let’s go back to the EZRADIUS portal and copy the url of your splunk instance and the token we just created.
- Click the “Test Connection” button, this will create a test log in your SIEM to make sure EZRADIUS can write to the SIEM.
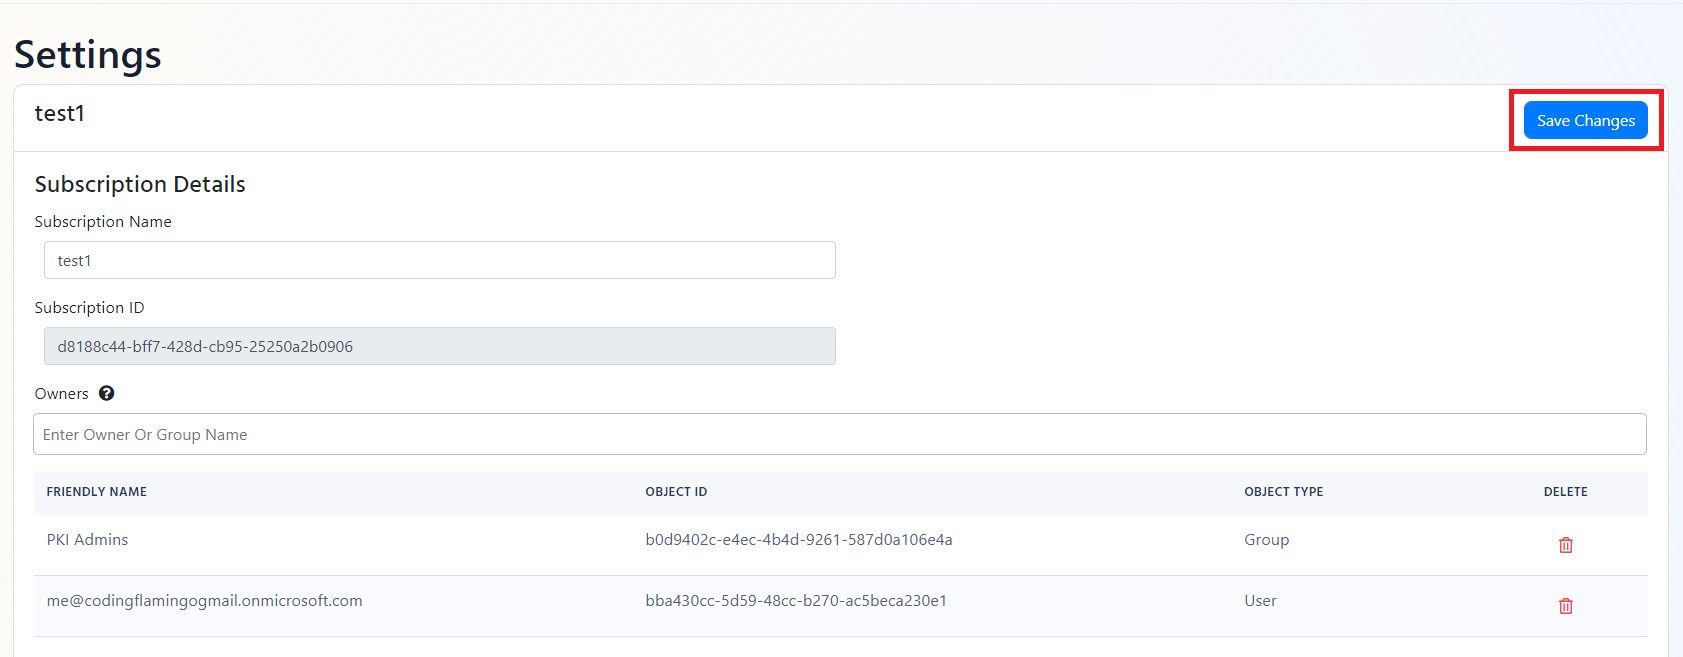
- If the connection test is successful, click “Save changes” at the top of the subscription.
- EZRADIUS will now send your security alerts to your SIEM. If an error occurs it will email your subscription administrators. See below to see the different events EZRADIUS will send.