How-To: Create Dashboards for EZRADIUS your Cloud RADIUS Service in Azure
In this page we go through how to create dashboards for your EZRADIUS service in Azure. This will enable you to monitor your RADIUS service and get insights into your user’s behavior.
Prerequisites
- The Keytos Entra applications are registered in your tenant
- You have an active EZRADIUS subscription
- You have connected your EZRADIUS subscription to Azure Sentinel or Log Analytics
How to Create Dashboards for EZRADIUS in Azure
If you are pushing your EZRADIUS logs to Azure Log Analytics, Azure Sentinel, or Azure Monitor, you can create dashboards to monitor your RADIUS service. We have created a dashboard template that you can import into your Azure Monitor workspace. Once imported, you can customize the dashboard to fit your needs.
- First, download the EZRADIUS Dashboard Template.
- Open the template in a text editor and replace the following placeholders with your information (Do find and replace all since there are multiple instances of each placeholder):
- Replace
$SIEMRESOURCEID$with the name full resource ID of your log analytics in the format/subscriptions/$SUBID$/resourcegroups/$RESOURCEGROUPNAME$/providers/microsoft.operationalinsights/workspaces/$WORSPACENAME$where$SUBID$is your Azure Subscription ID,$RESOURCEGROUPNAME$is your resource group name, and$WORSPACENAME$is the workspace name for your log analytics. - Replace
$DASHBOARDNAME$with the name of your Dashboard.
- Replace
- Save the file.
- Go to your Azure Portal.
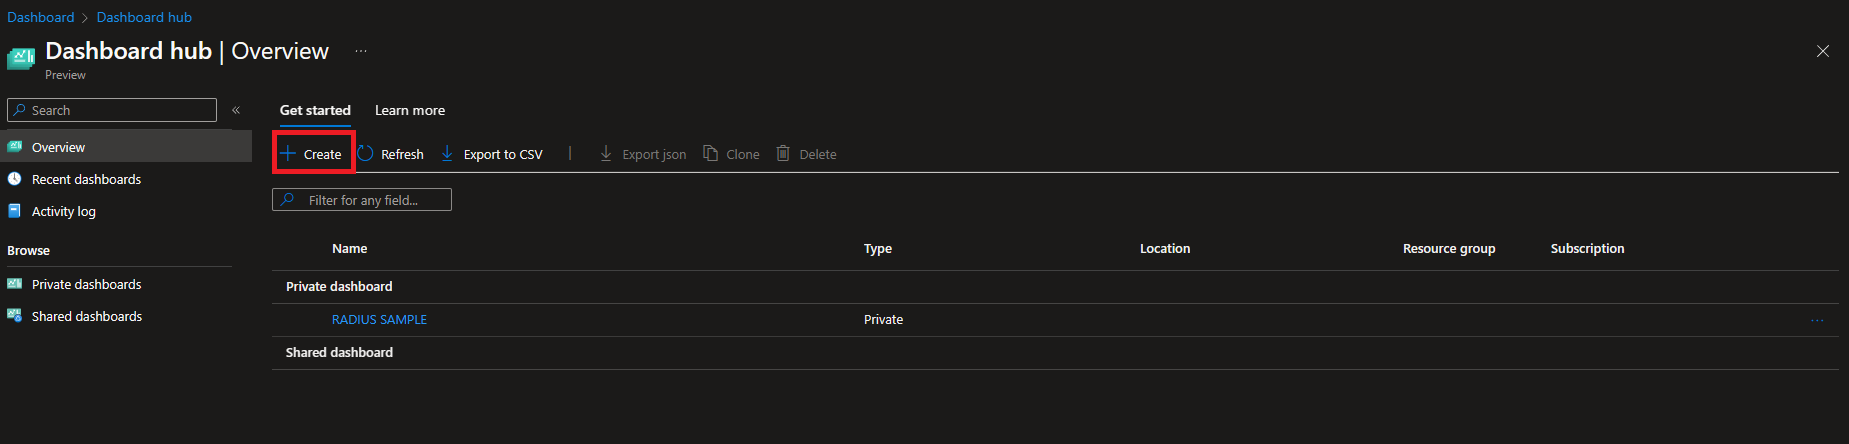
- Search for “Dashboard Hub” and click on it.
- Click on “Create Dashboard”.
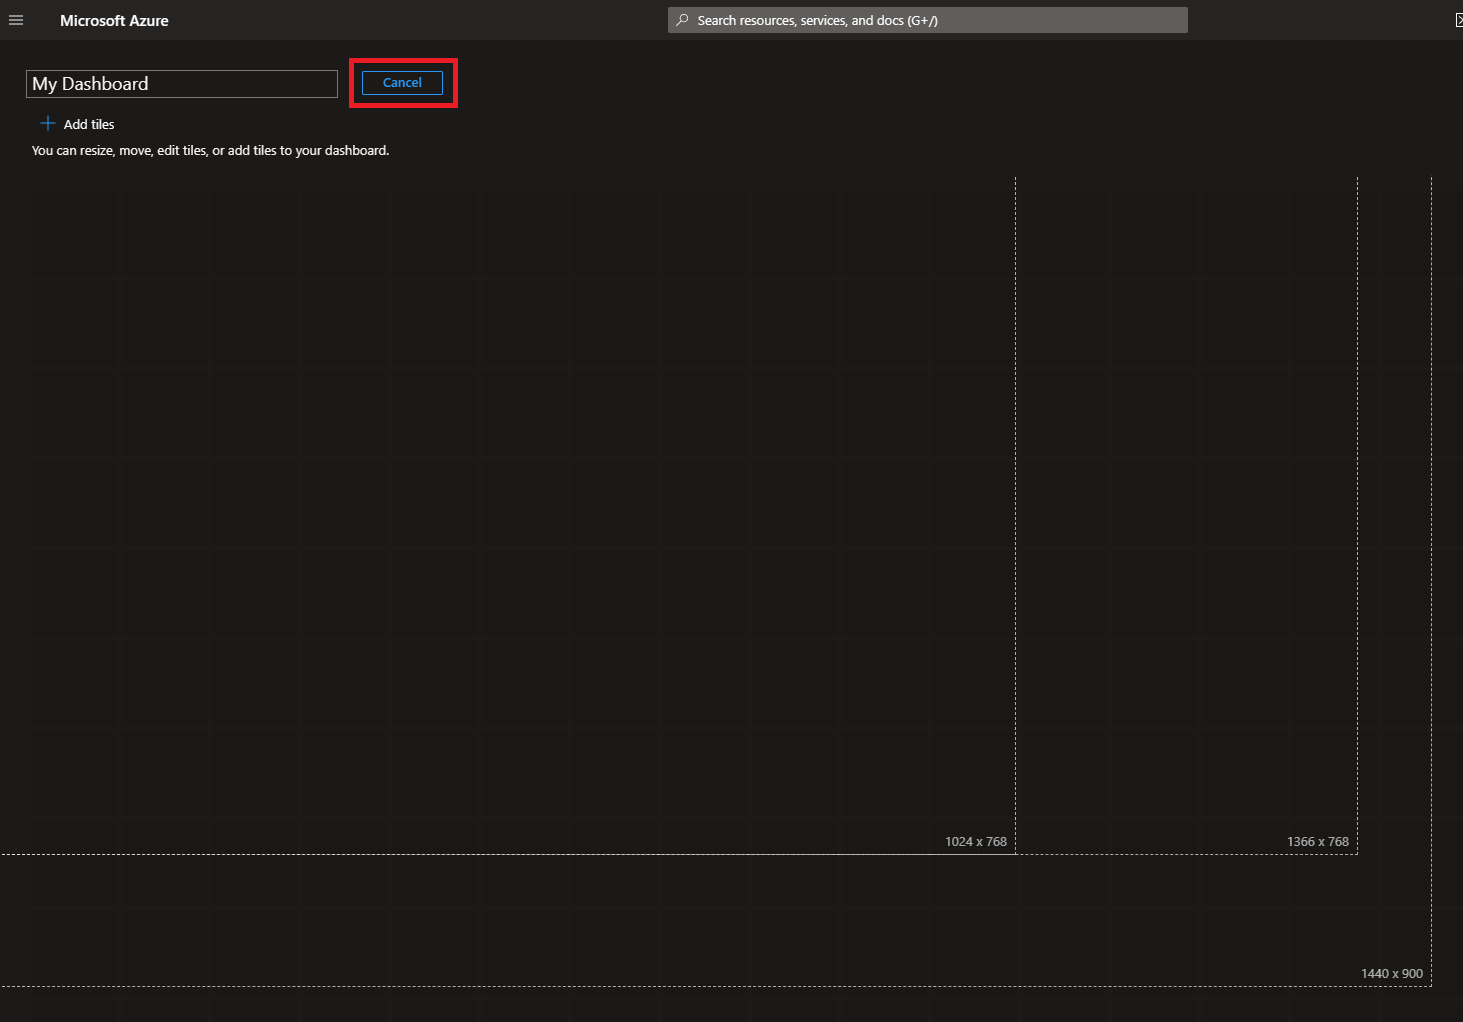
- Click on Custom dashboard.
- Click on “Cancel”
- Click on “Upload” and select the template file you saved.
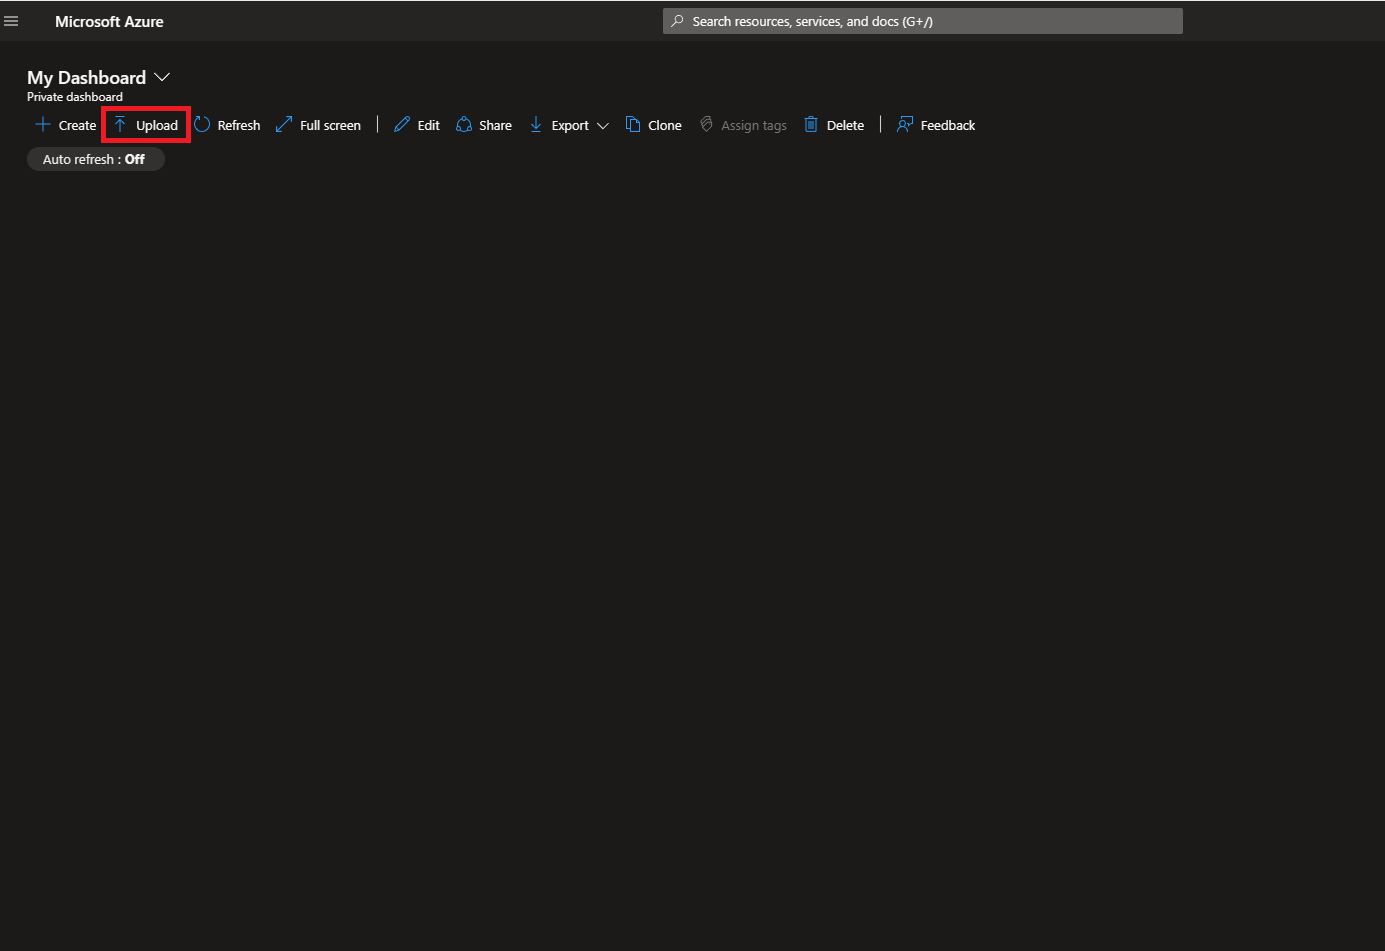
- This will create a new dashboard with the name you specified in the template.
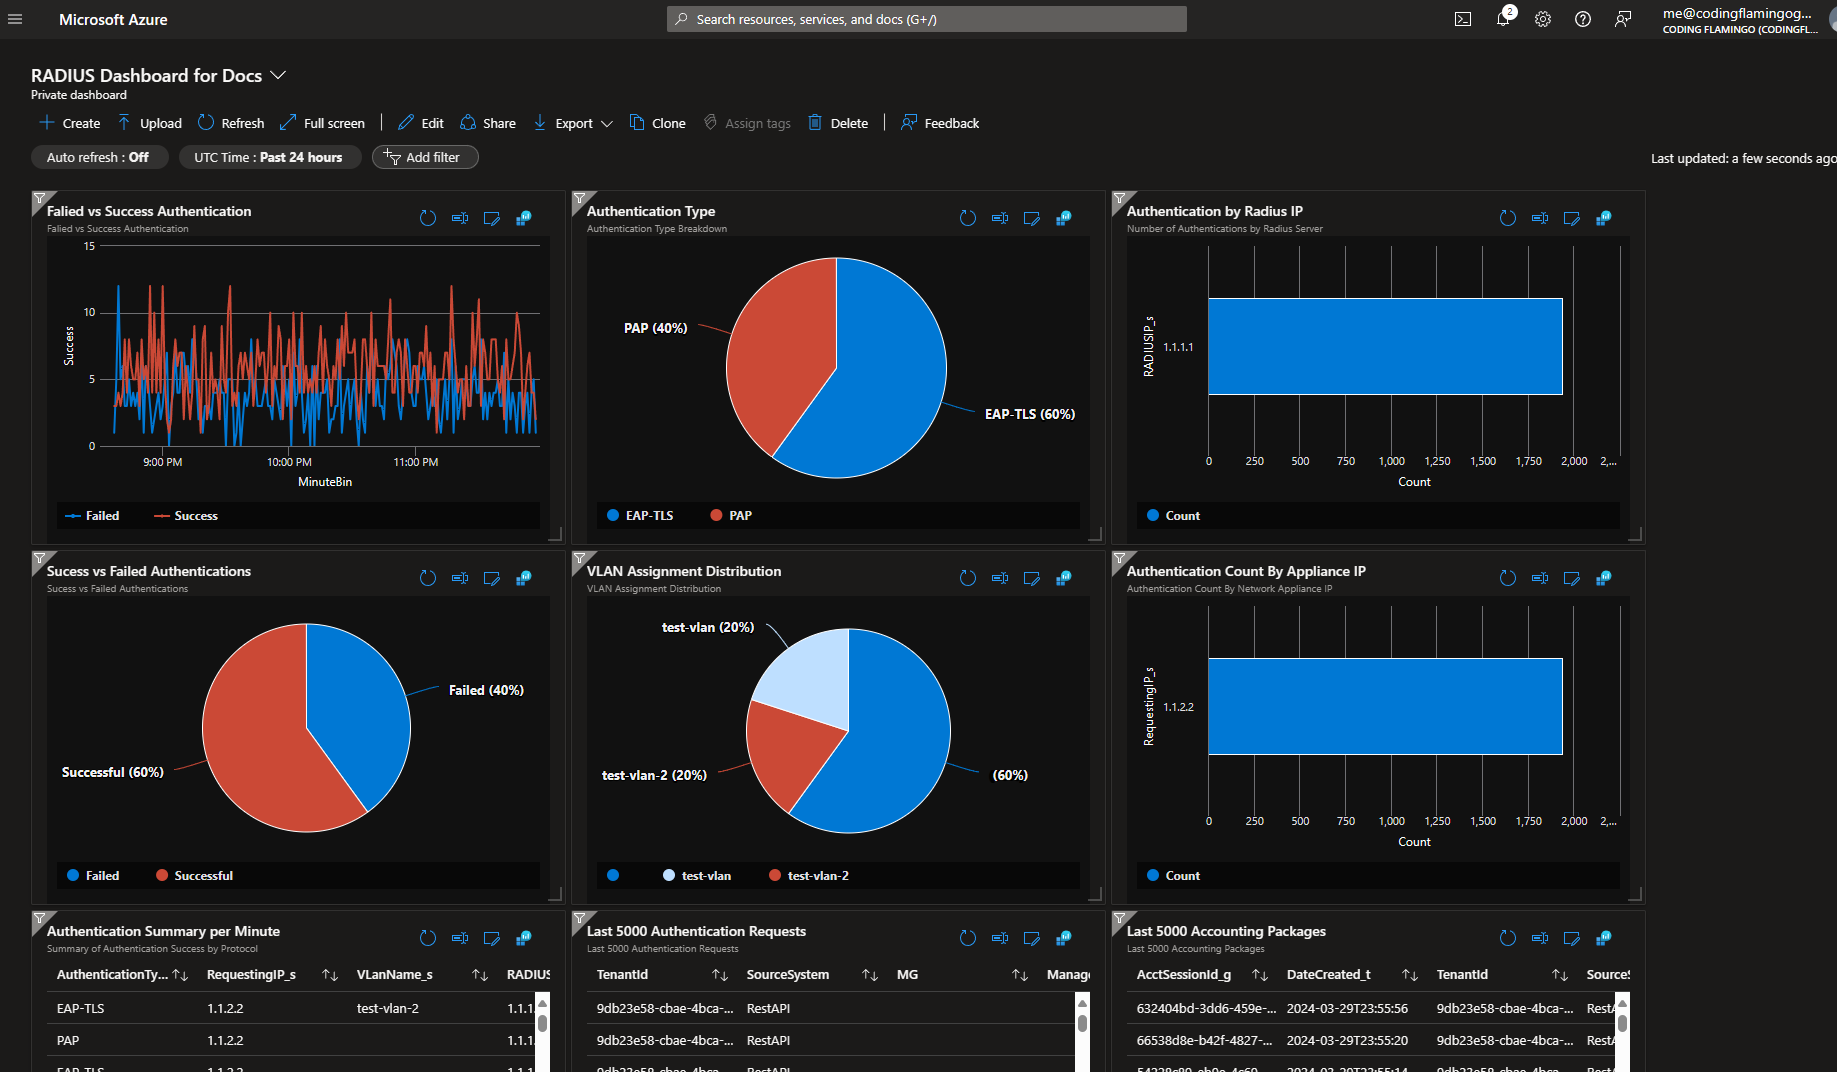
- You can now customize the dashboard to fit your needs by adding or removing widgets.