How-To: Export your RADIUS Logs to CloudWatch
Prerequisites
How To Export Your Cloud RADIUS Audit Logs To CloudWatch
How To Enable Log Export in EZRADIUS Portal
-
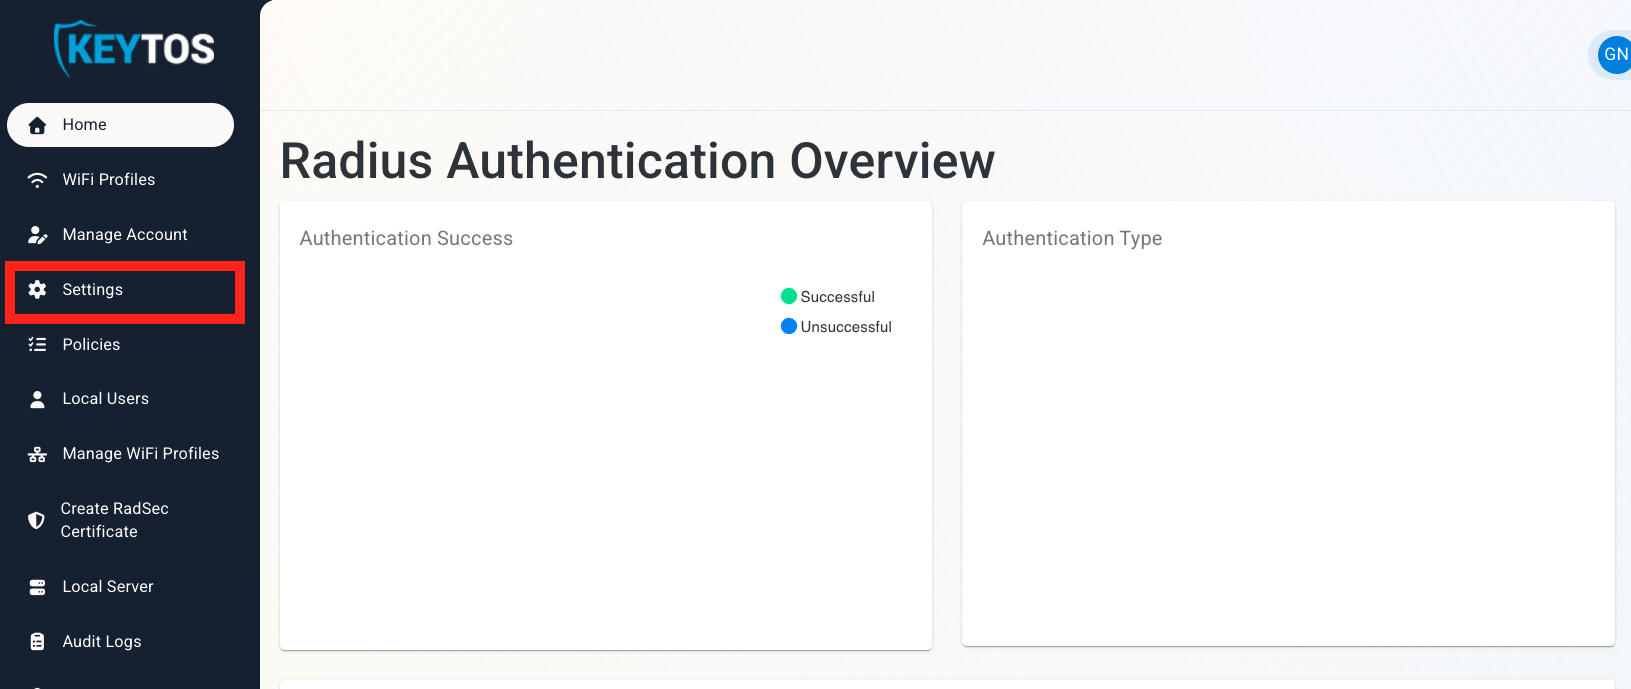
Go to your EZRADIUS Portal.
-
Click on Settings.
-
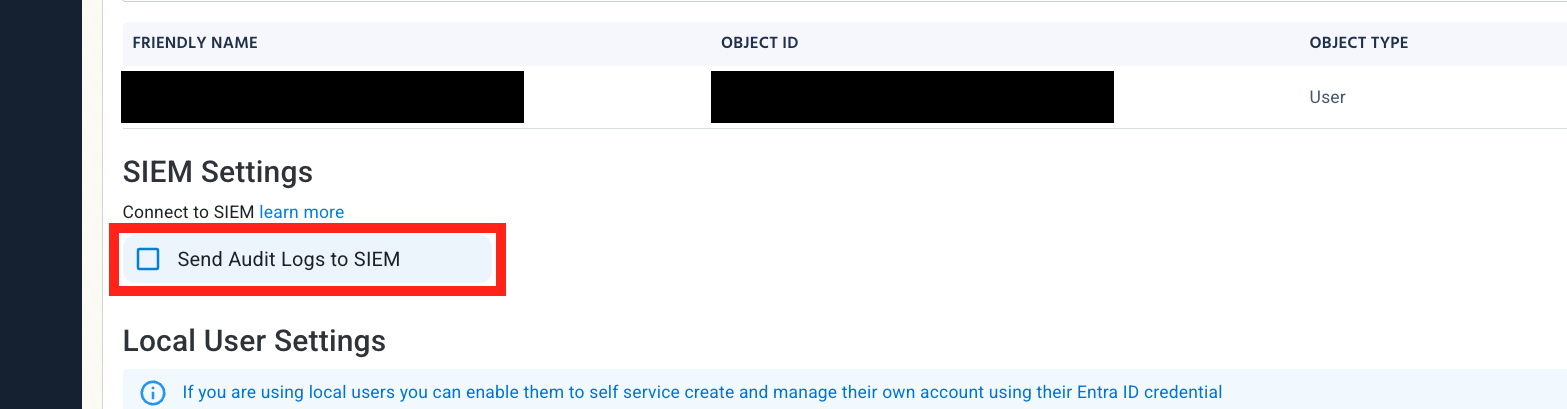
Scroll down to SIEM Settings and enable the Send Audit Logs to SIEM option.
How To Configure CloudWatch Logs in the CloudWatch Portal
-
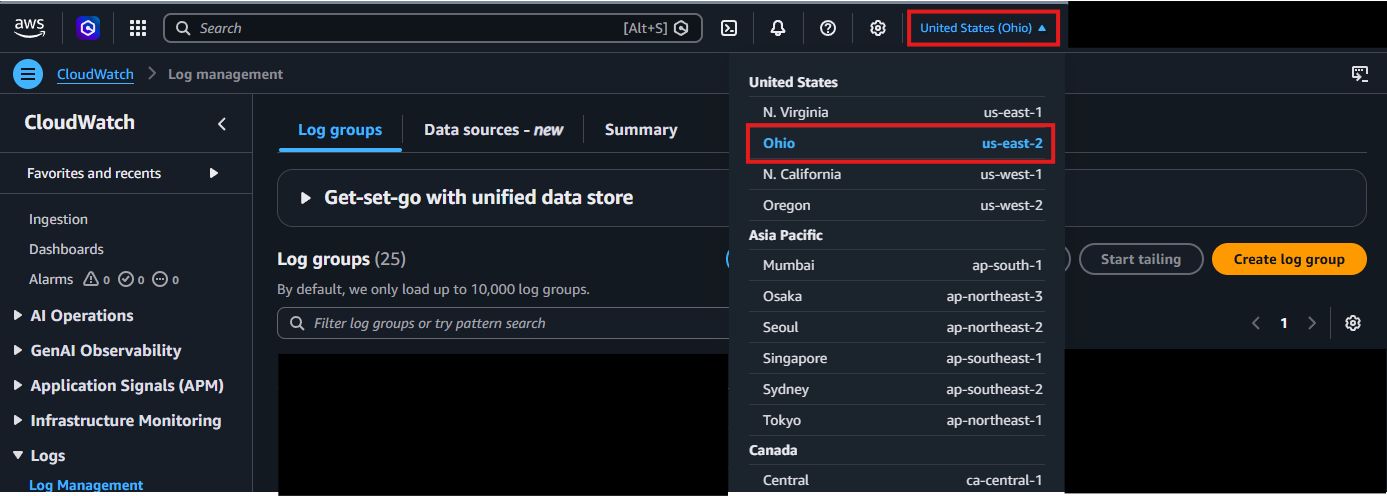
Open your CloudWatch Portal in a new browser tab.
-
In the top right corner, locate your AWS Region and make a note of it.
-
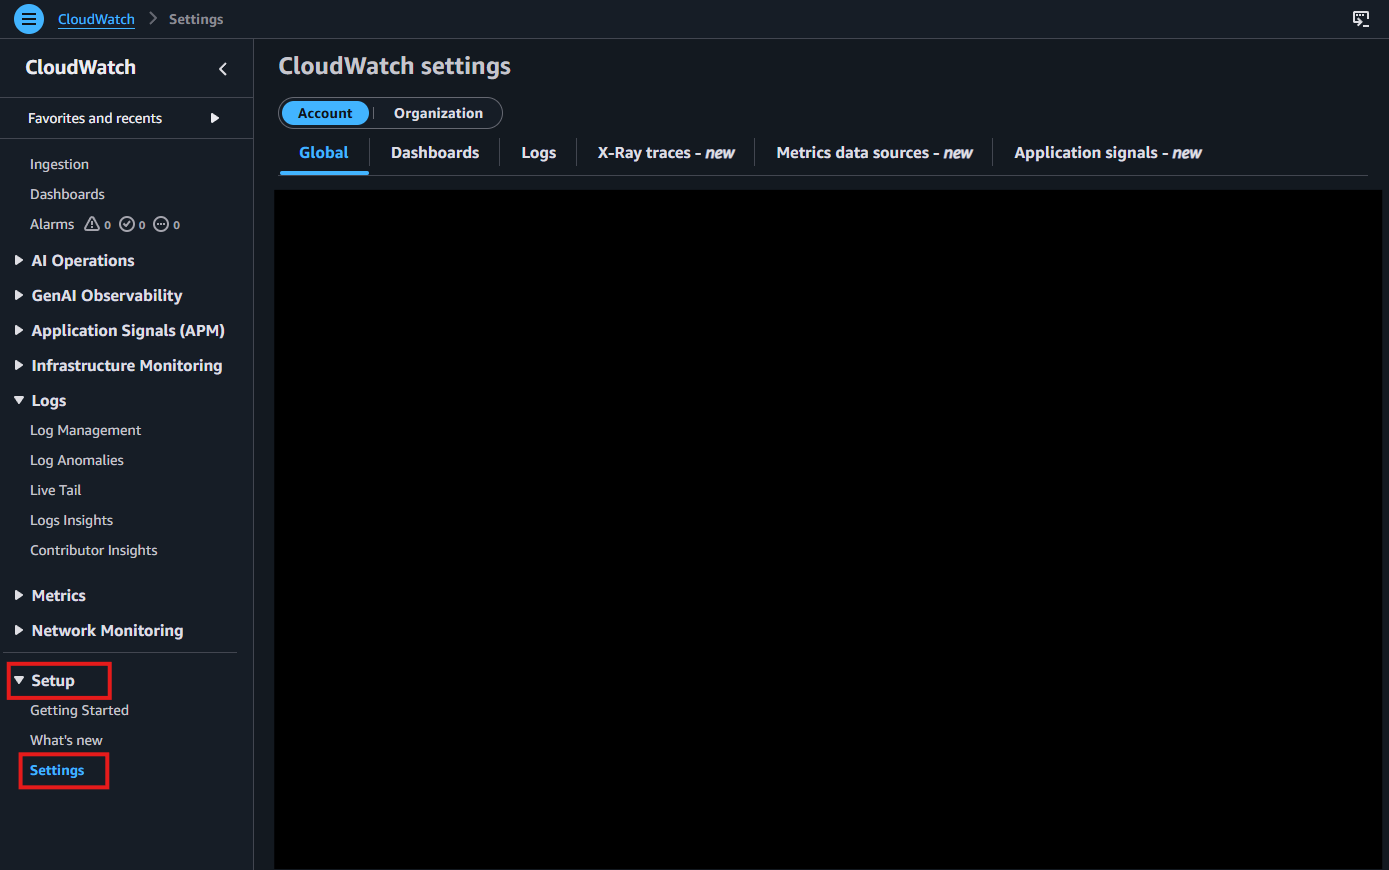
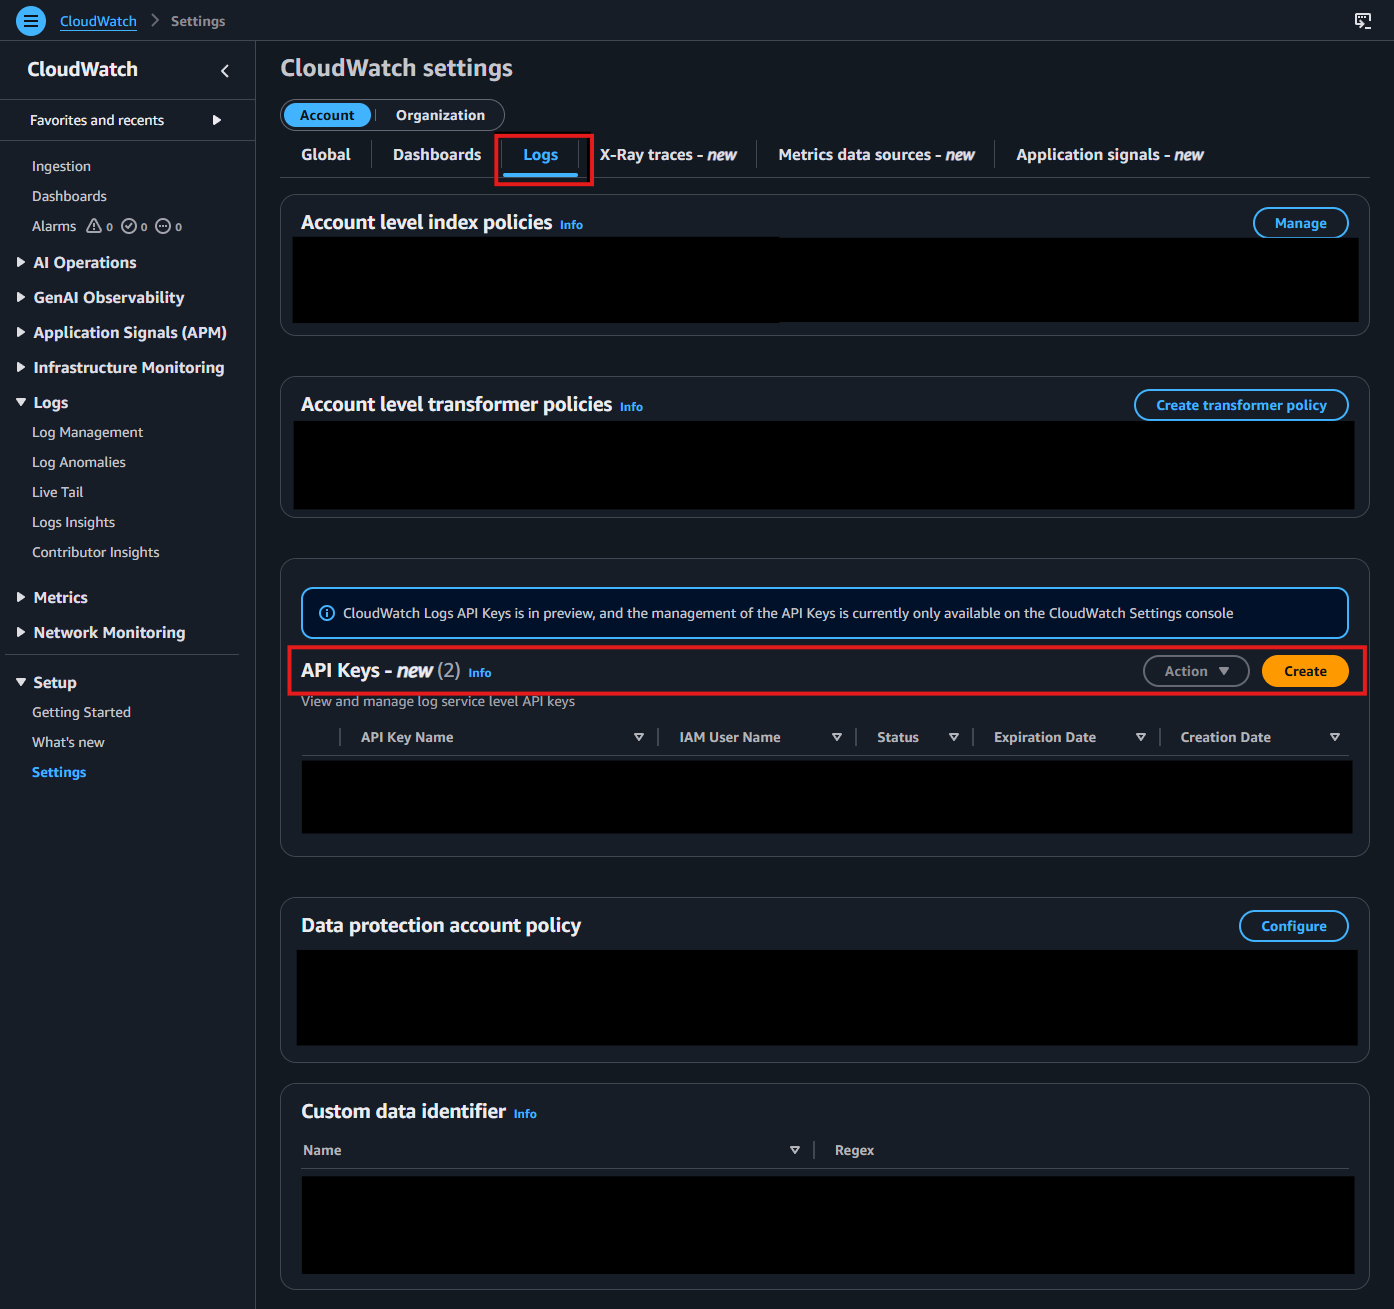
From the left-hand menu, under Setup, click on Settings.
-
Go to the Logs tab. In the API Keys section, click Create.
-
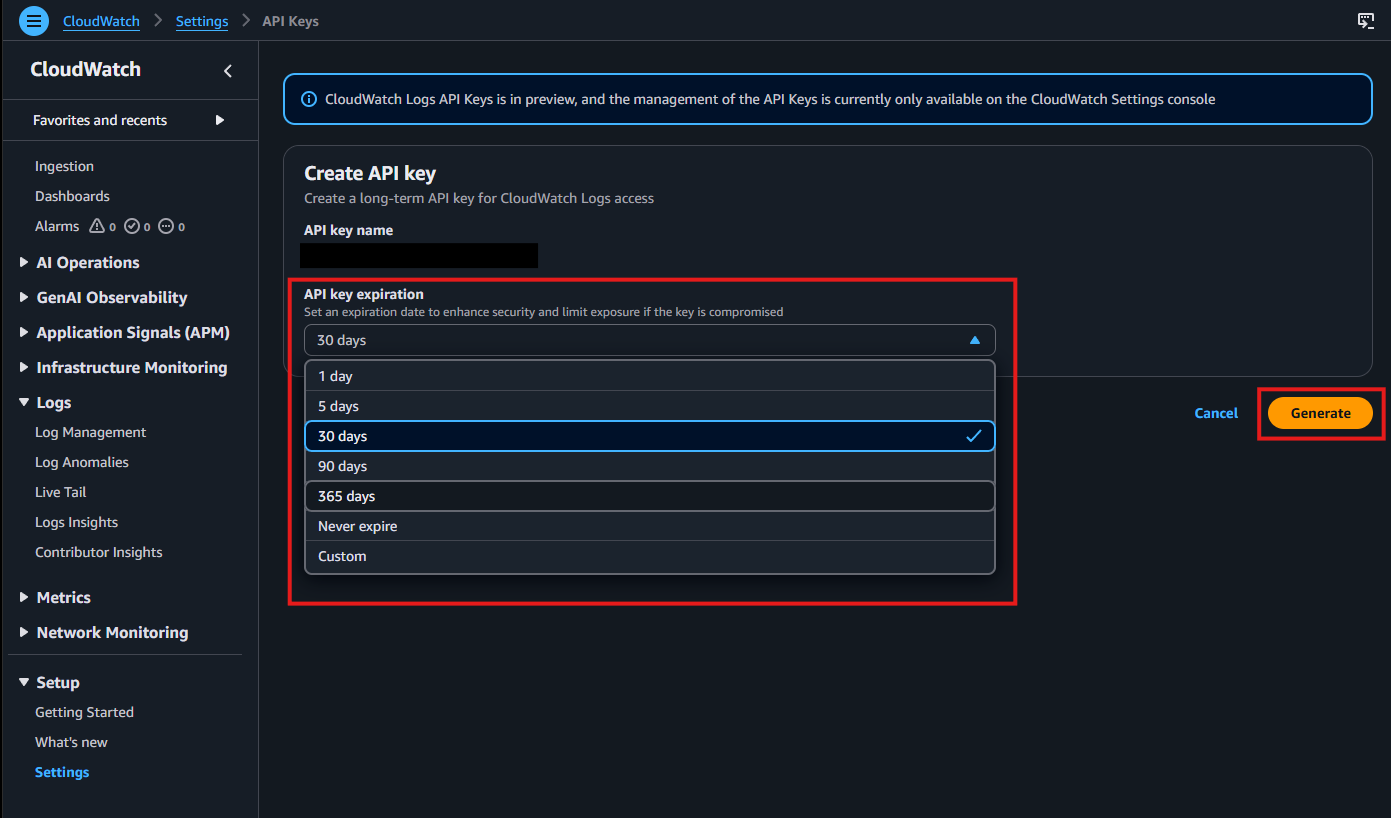
Choose your preferred API key expiration, then click Generate.
-
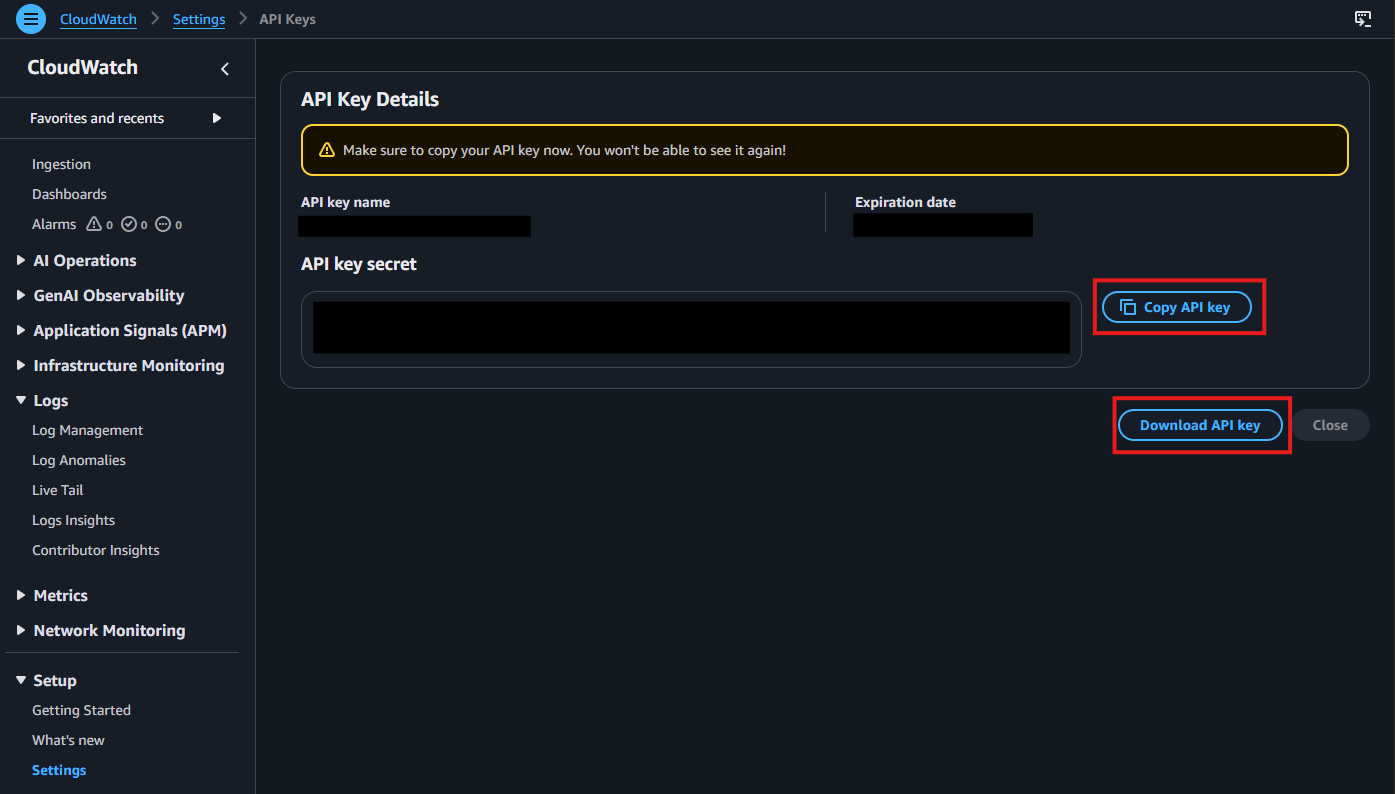
After the key is generated, copy and save it immediately. You will not be able to view it again after leaving this page.
-
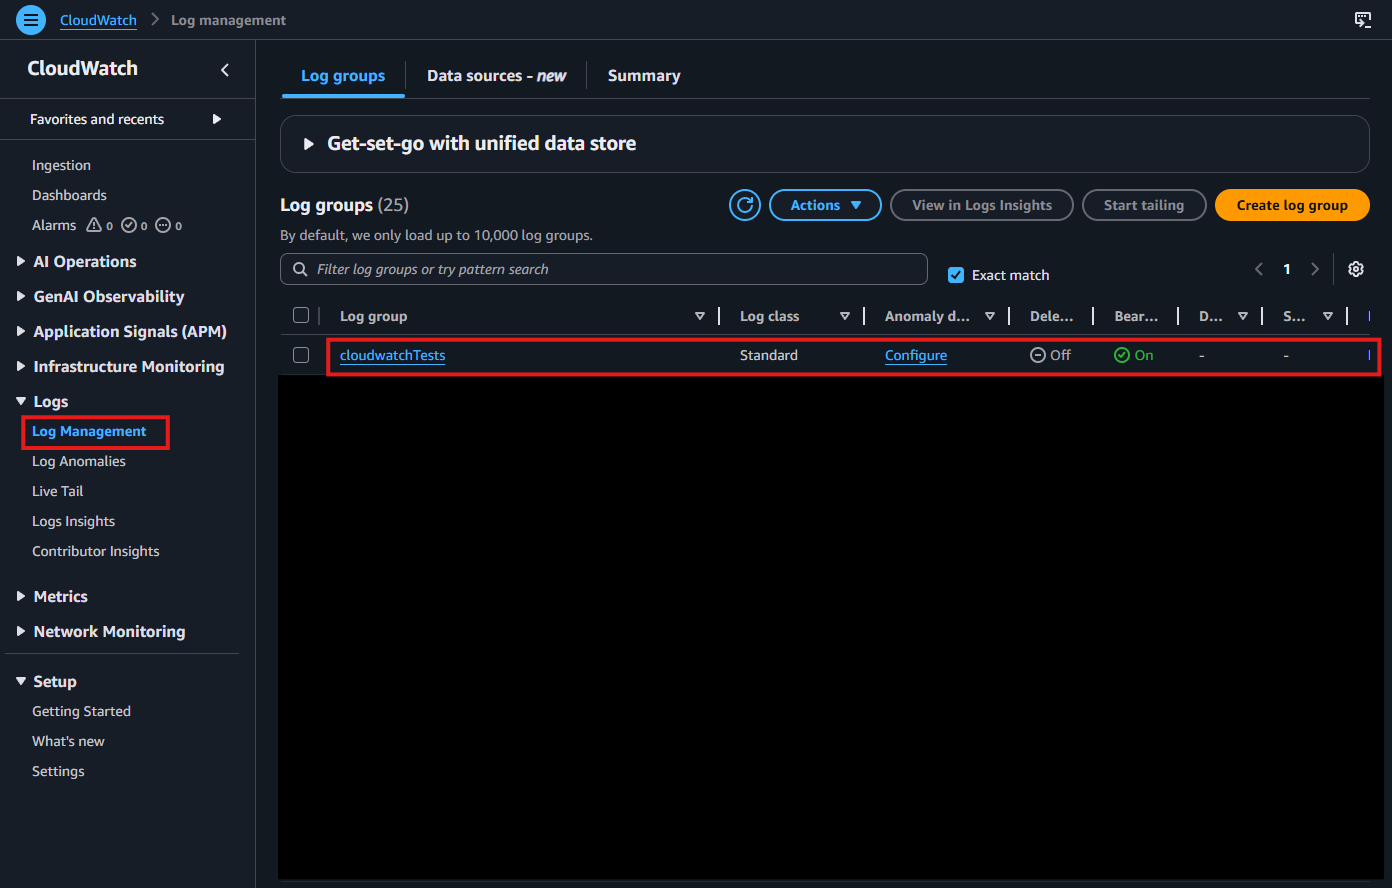
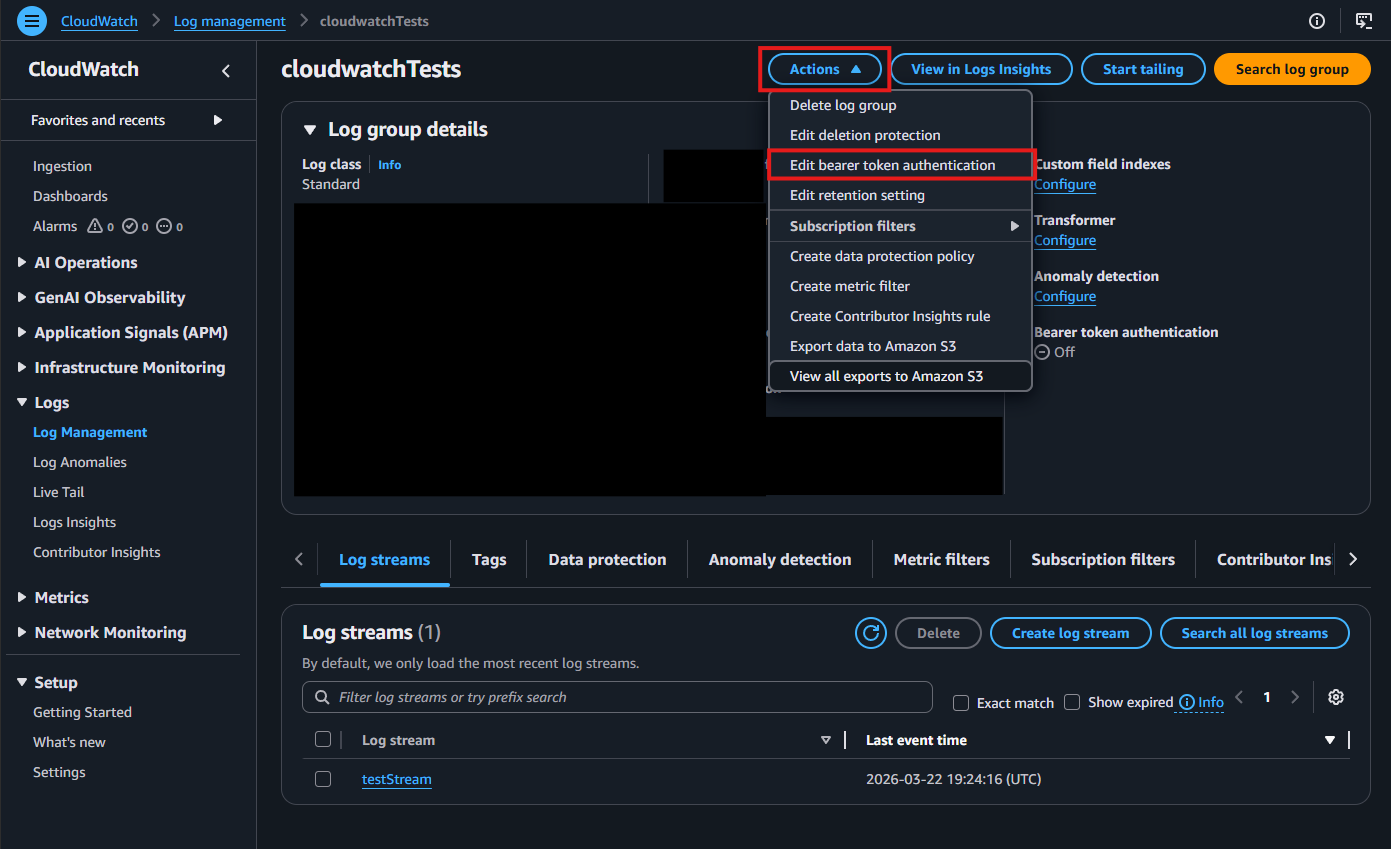
Navigate to Log Management under Logs in the left-hand menu. Select the Log Group where you want to deliver your logs.
-
Click the Actions dropdown, then select Edit bearer token authentication.
-
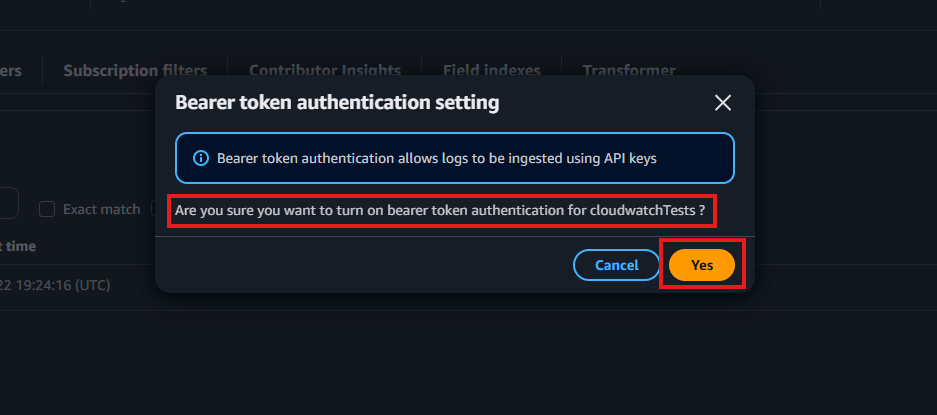
When prompted, enable bearer token authentication by selecting Yes.
-
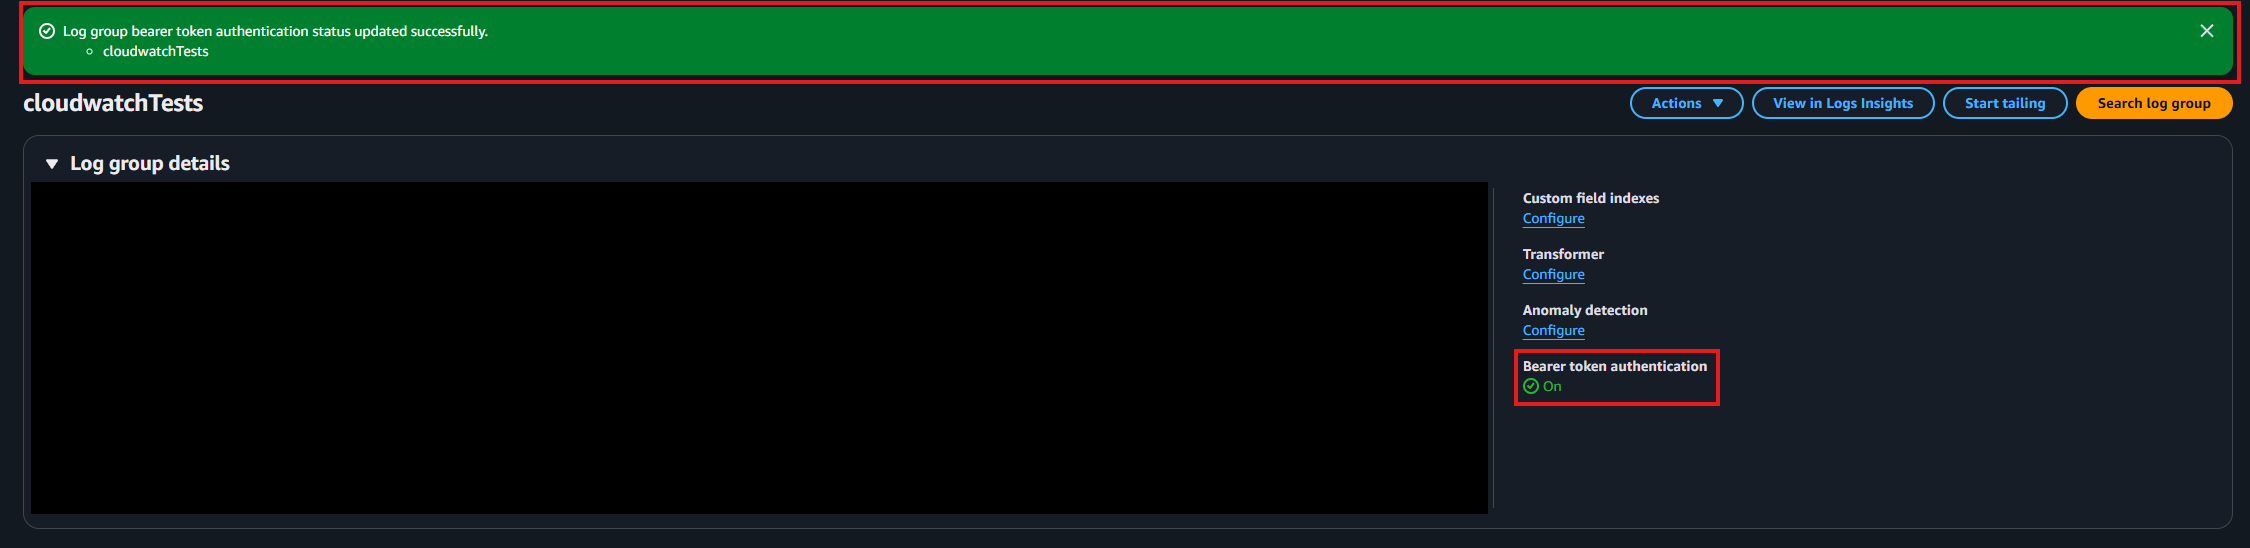
Confirm that bearer token authentication is enabled.
-
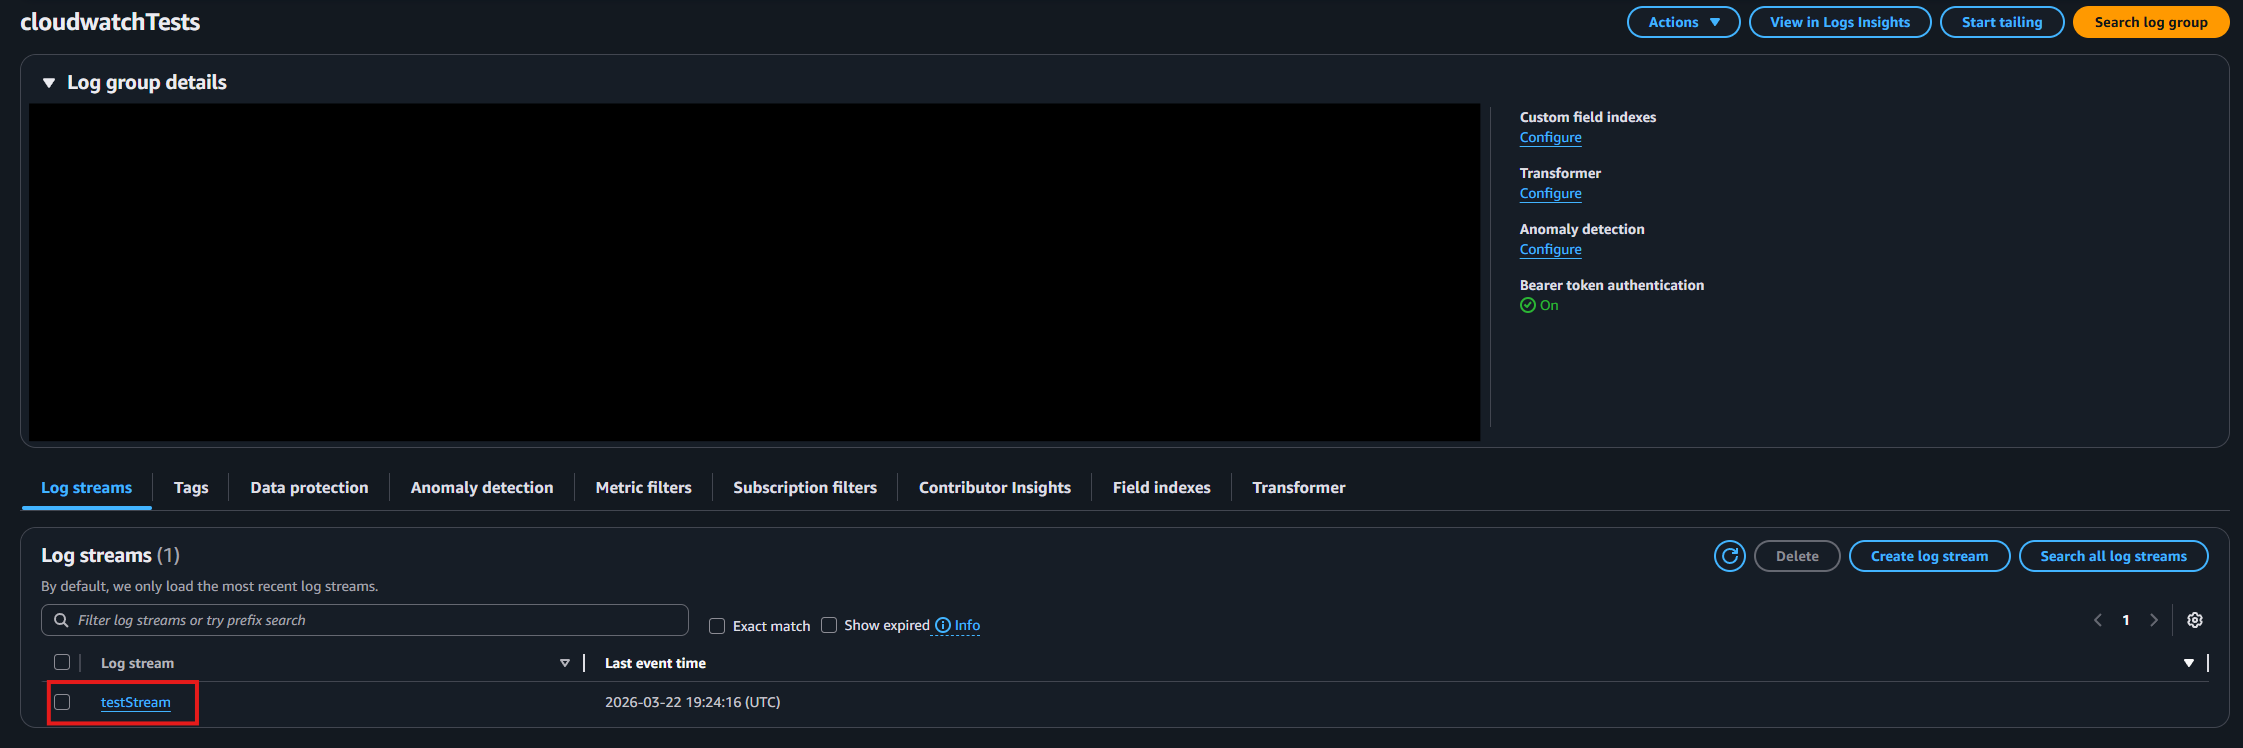
Identify and note the log stream where you want your logs delivered.
How To Configure the CloudWatch SIEM in EZRADIUS Portal
-
Now go back to the EZRADIUS Portal.
-
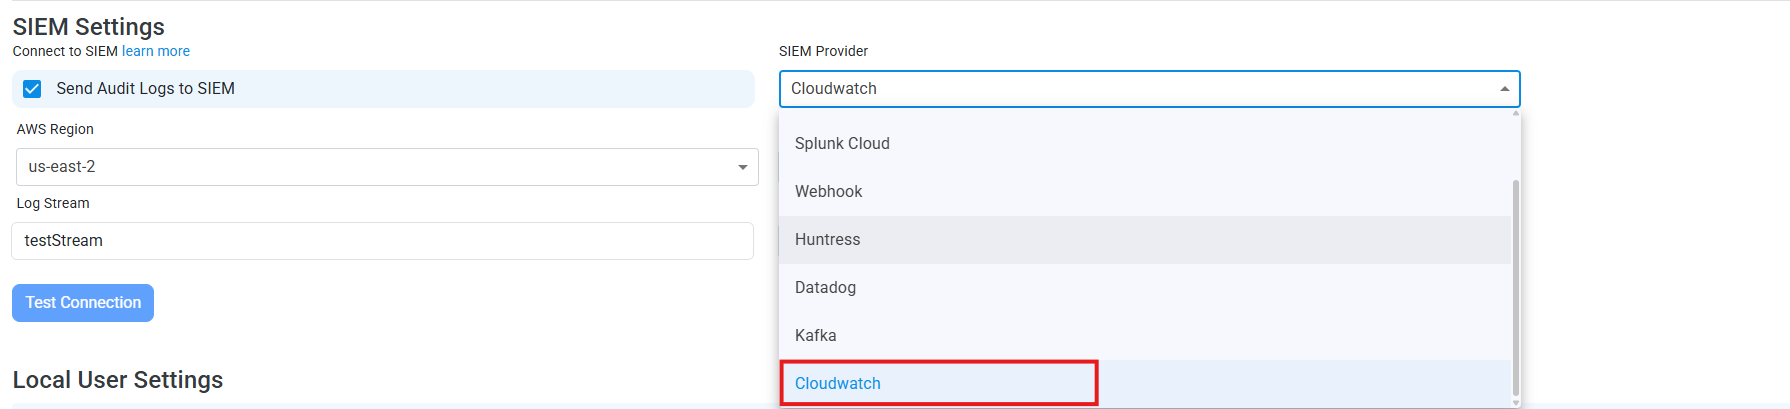
Select CloudWatch as the SIEM Provider.
-
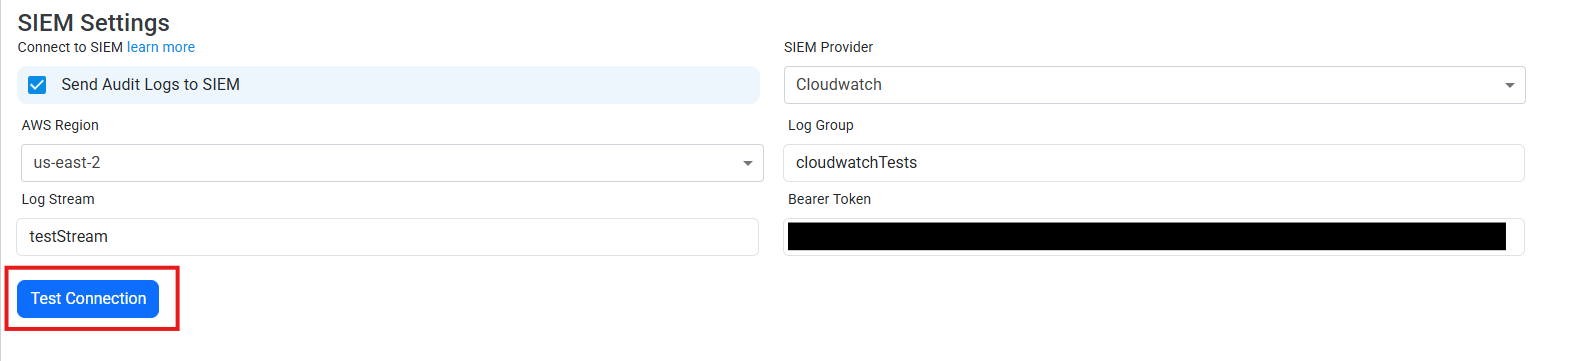
Input the values that you copied from the CloudWatch portals. Then, click Test Connection. This will create a test log in your CloudWatch SIEM (please allow a few minutes for the log to show up in the CloudWatch portal).
-
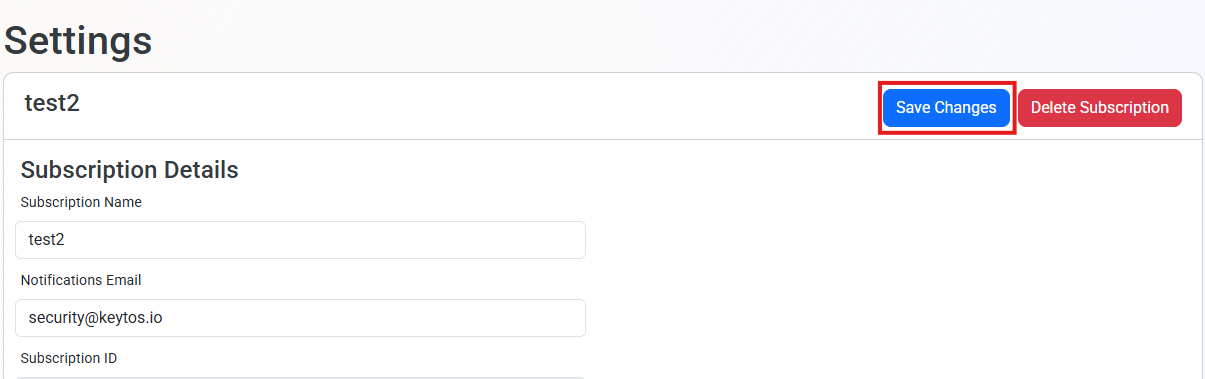
If the connection test is successful, click Save changes
-
EZRADIUS will now send your security alerts to your SIEM. If an error occurs it will email your subscription administrators. See below to see the different events EZRADIUS will send.
How To Create Alerts in CloudWatch to Monitor Your Cloud RADIUS Activity
We recommend setting up alerts for any high criticality event, and closely monitor medium and low events. To setup alerts in CloudWatch go to Actions -> Create metric filter within your log group. Here are some example filters to get you started:
{ $.source = "EZRadius" && $.sourcetype = "EZRadiusAdministrator" && $.event.Action = "SubscriptionUpdated" }